Create and customize an item velocity report in Infoplus to let you know which items are shipping more frequently than others.
What is Item Velocity?
Item velocity is data about a business's items and their shipping frequencies. An Item Velocity report will show information about which items are shipped the most, which are not shipped at all, which have spikes at certain times in the year, etc.
Use the instructions below to create a customized Item Velocity Report in your Infoplus install.
How to Create an Item Velocity Report
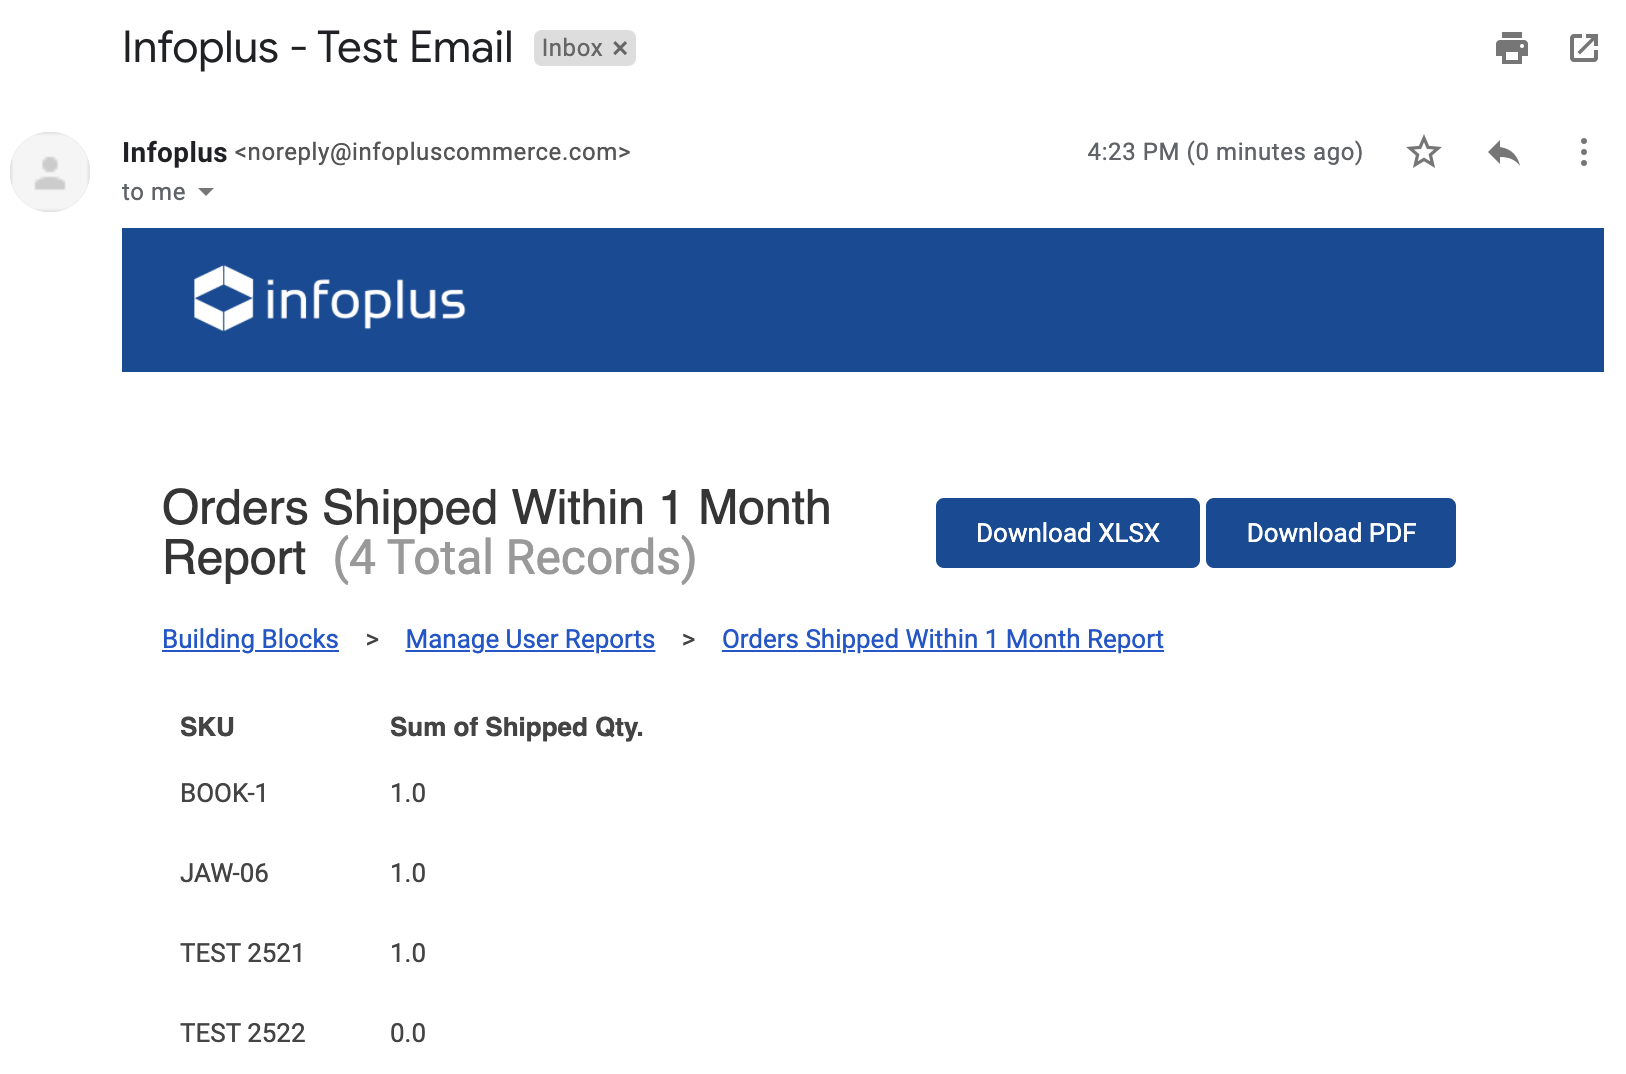
This is an example of most shipped orders in the past x months:
- Navigate to the Order Line Table
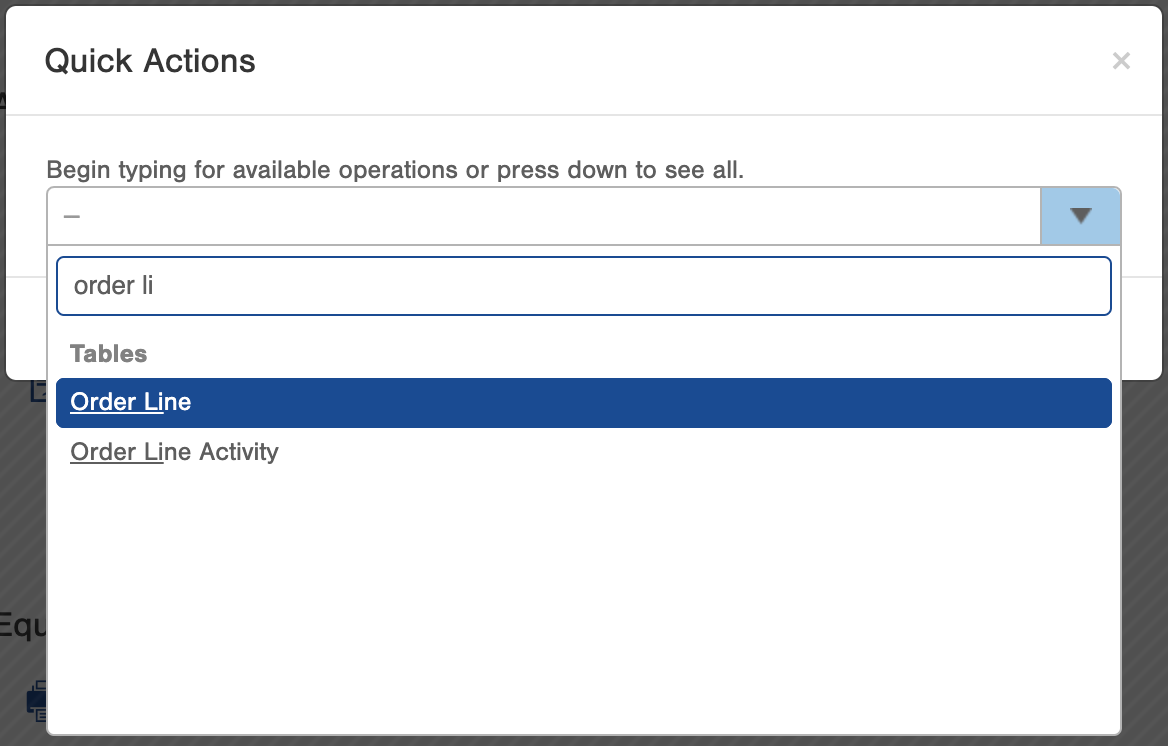
- Use the Quick Actions by clicking on the period key (.) and begin typing in "Order Line". Click on Order Line from the drop-down when it appears.
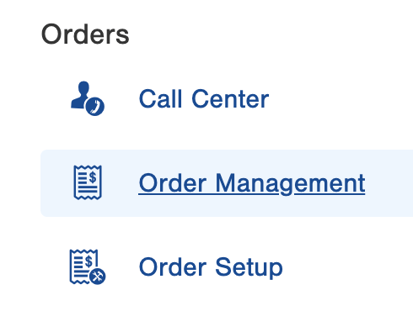
- On the homepage, go to Apps>Orders>Order Management>Order Line
- Use the Quick Actions by clicking on the period key (.) and begin typing in "Order Line". Click on Order Line from the drop-down when it appears.
- Filter the column headers to show the data related to your desired output (eg: all shipped orders within 1 month, etc.)
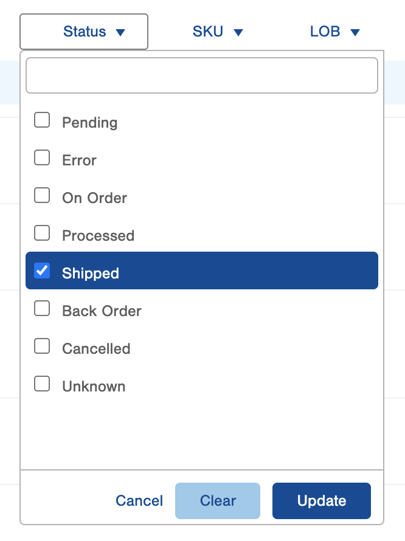
- Status = Shipped
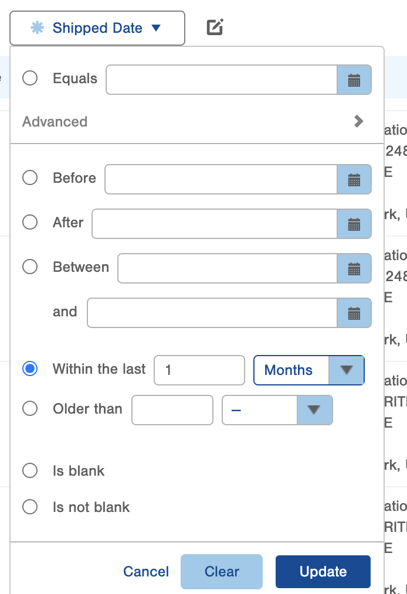
- Shipped Date = Within the Last 'X' Months
- Status = Shipped
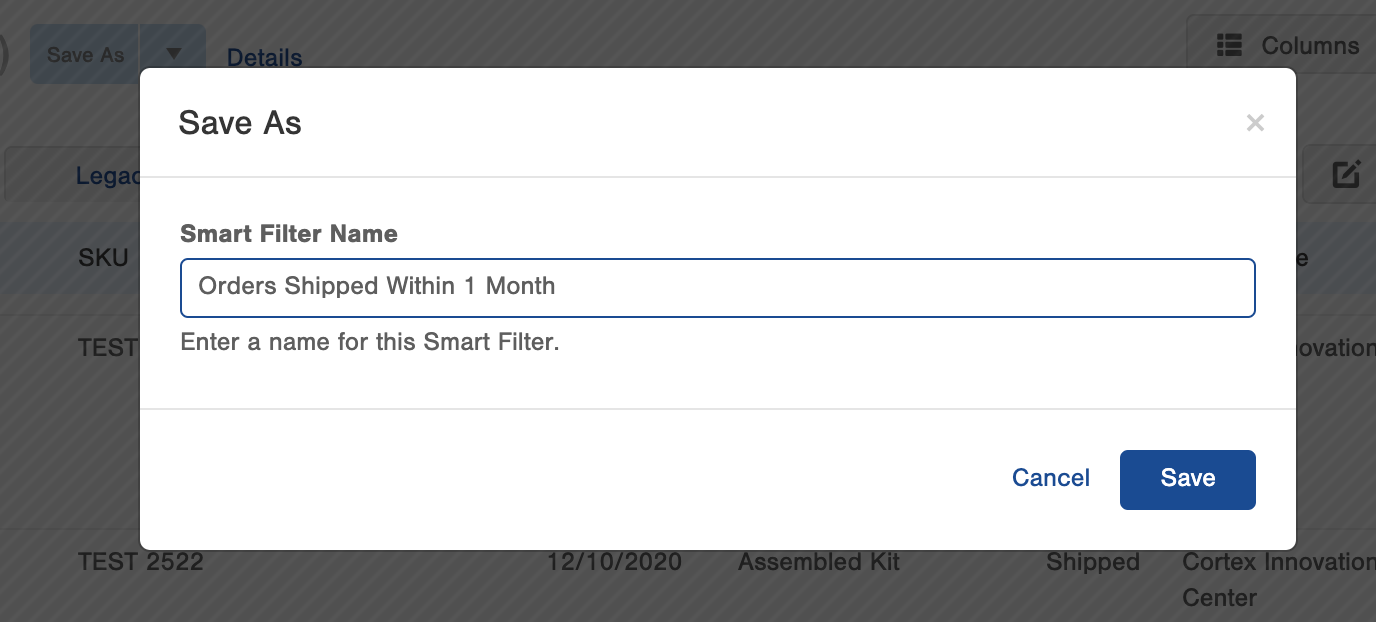
- Save as a Smart Filter and name it something related to the output of data, such as "Orders Shipped within 1 Month"
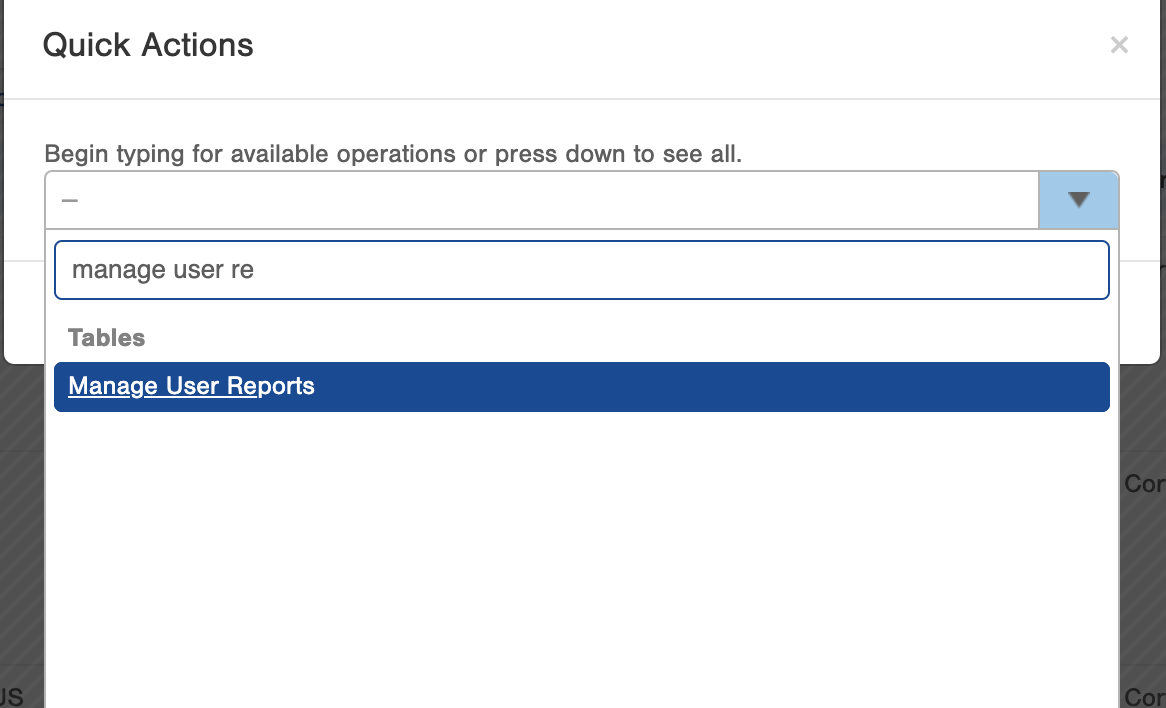
- Now, navigate to the Manage User Reports Table
- Once on the table, select Create New in the top right corner
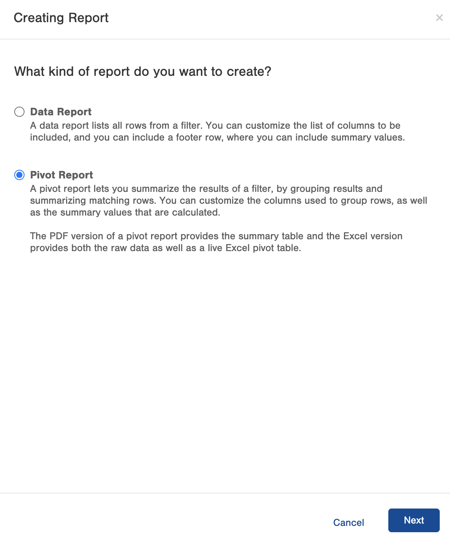
- Select Pivot Report
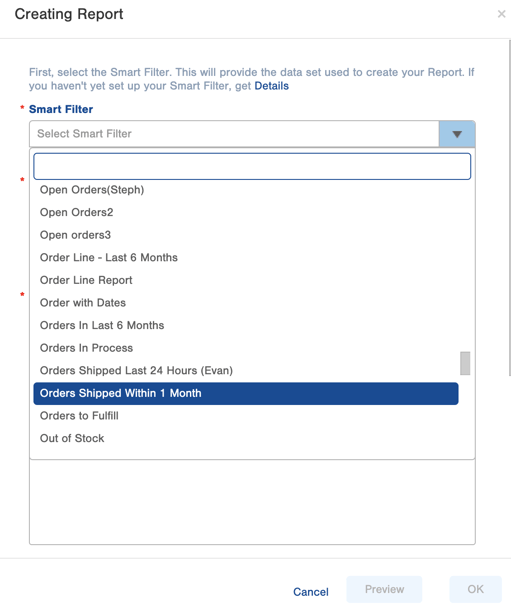
- Select Smart Filter (use the one created in step 3)
- Add an additional column of Shipped Quantity
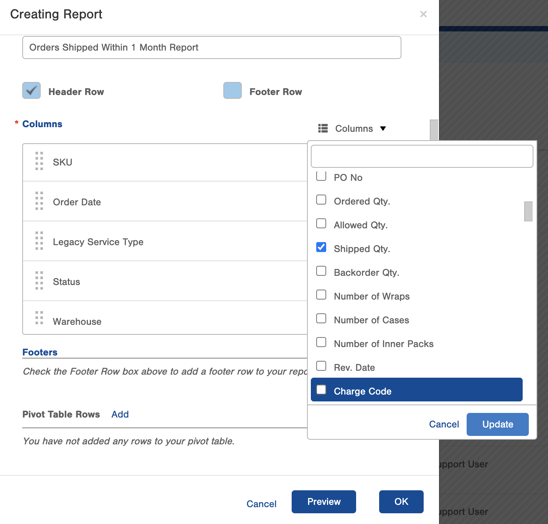
- On Pivot Table Row, click add
- Select SKU

- Select SKU
- On Pivot Table Values, click add
- Select Shipped Quantity
- Select Sum (to ensure multiples per order are counted, choose "sum" and not "count"

- Click OK
- Select Pivot Report
- Once on the table, select Create New in the top right corner
Now that the report is created, you can view it at any time and even add the data to your Infoplus dashboard.
You can utilize this method for report-creating for almost any data you would like to keep track of within your Infoplus install.
Create A Subscription
Once you have created and saved the report, it will show up in the Manage User Reports table.
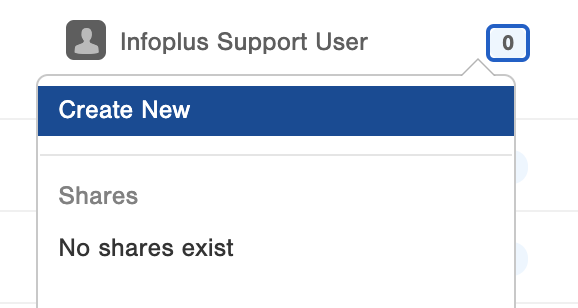
To create a subscription for this report, find the report's row on the Manage User Reports Table, navigate to the 'Subscriptions' column, and click on the bubble, which will likely have a '0' in it. Then, click on 'Create New'. 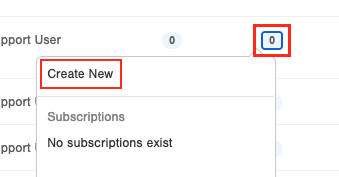
Pro Tip: A subscription is an email that will be automatically sent to a specific email address at a selected date and time with the requested information attached to said email.
Pro Tip: You can also click on current subscriptions to edit them or delete them. Users can create as many subscriptions as you need. For example, the day shift manager might want to receive this report at a different time than the night shift manager, or a warehouse manager might want it on a daily basis whereas the CEO want's it monthly.
Setting up the Subscription
Tell Infoplus when and where to send out the report.
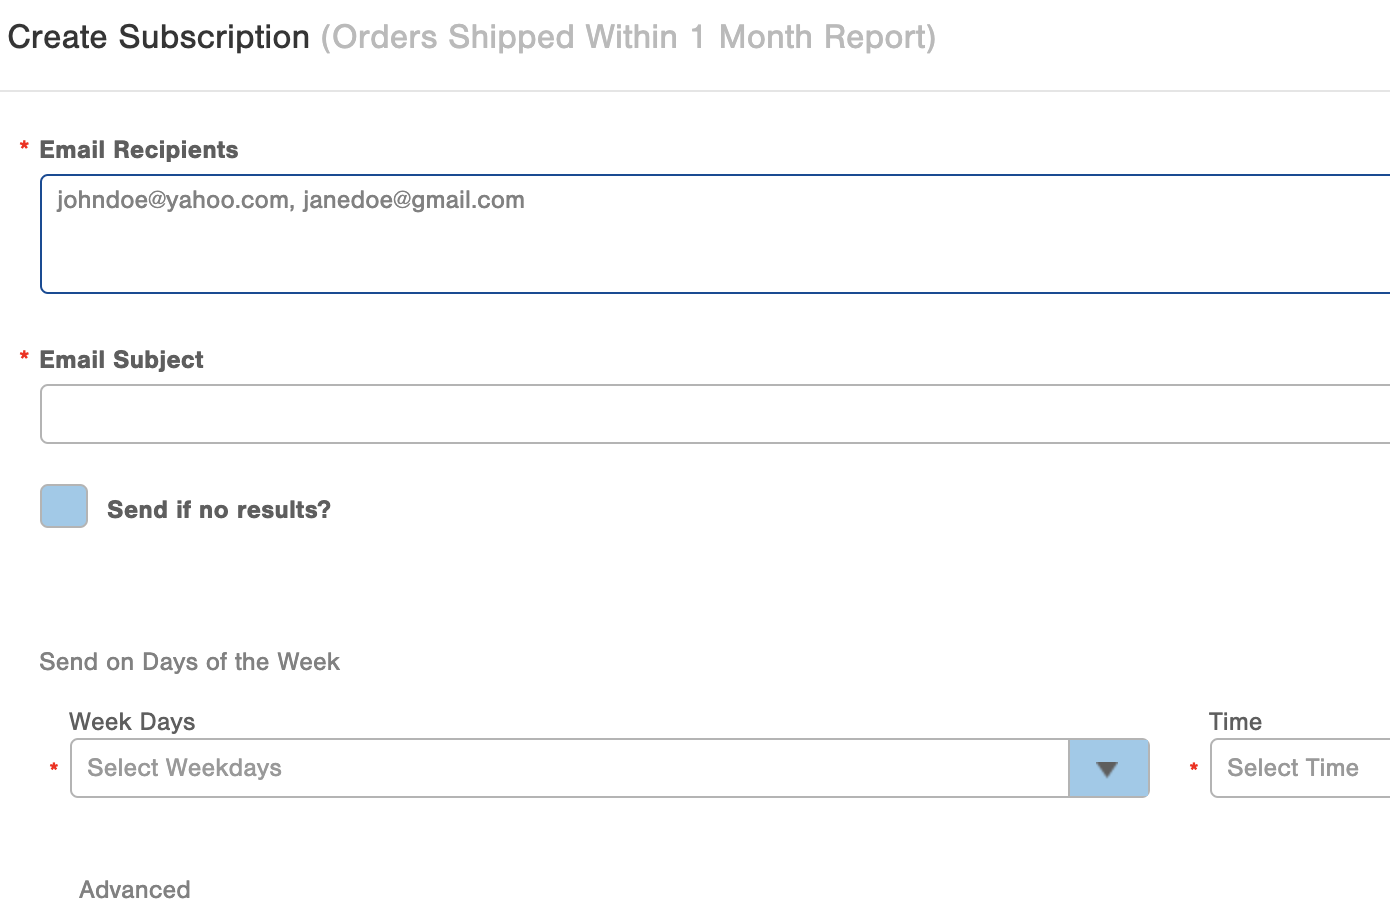
- Enter all recipients separated by commas
- Enter an appropriate subject line
- Select whether you want the report to send out if there are no results
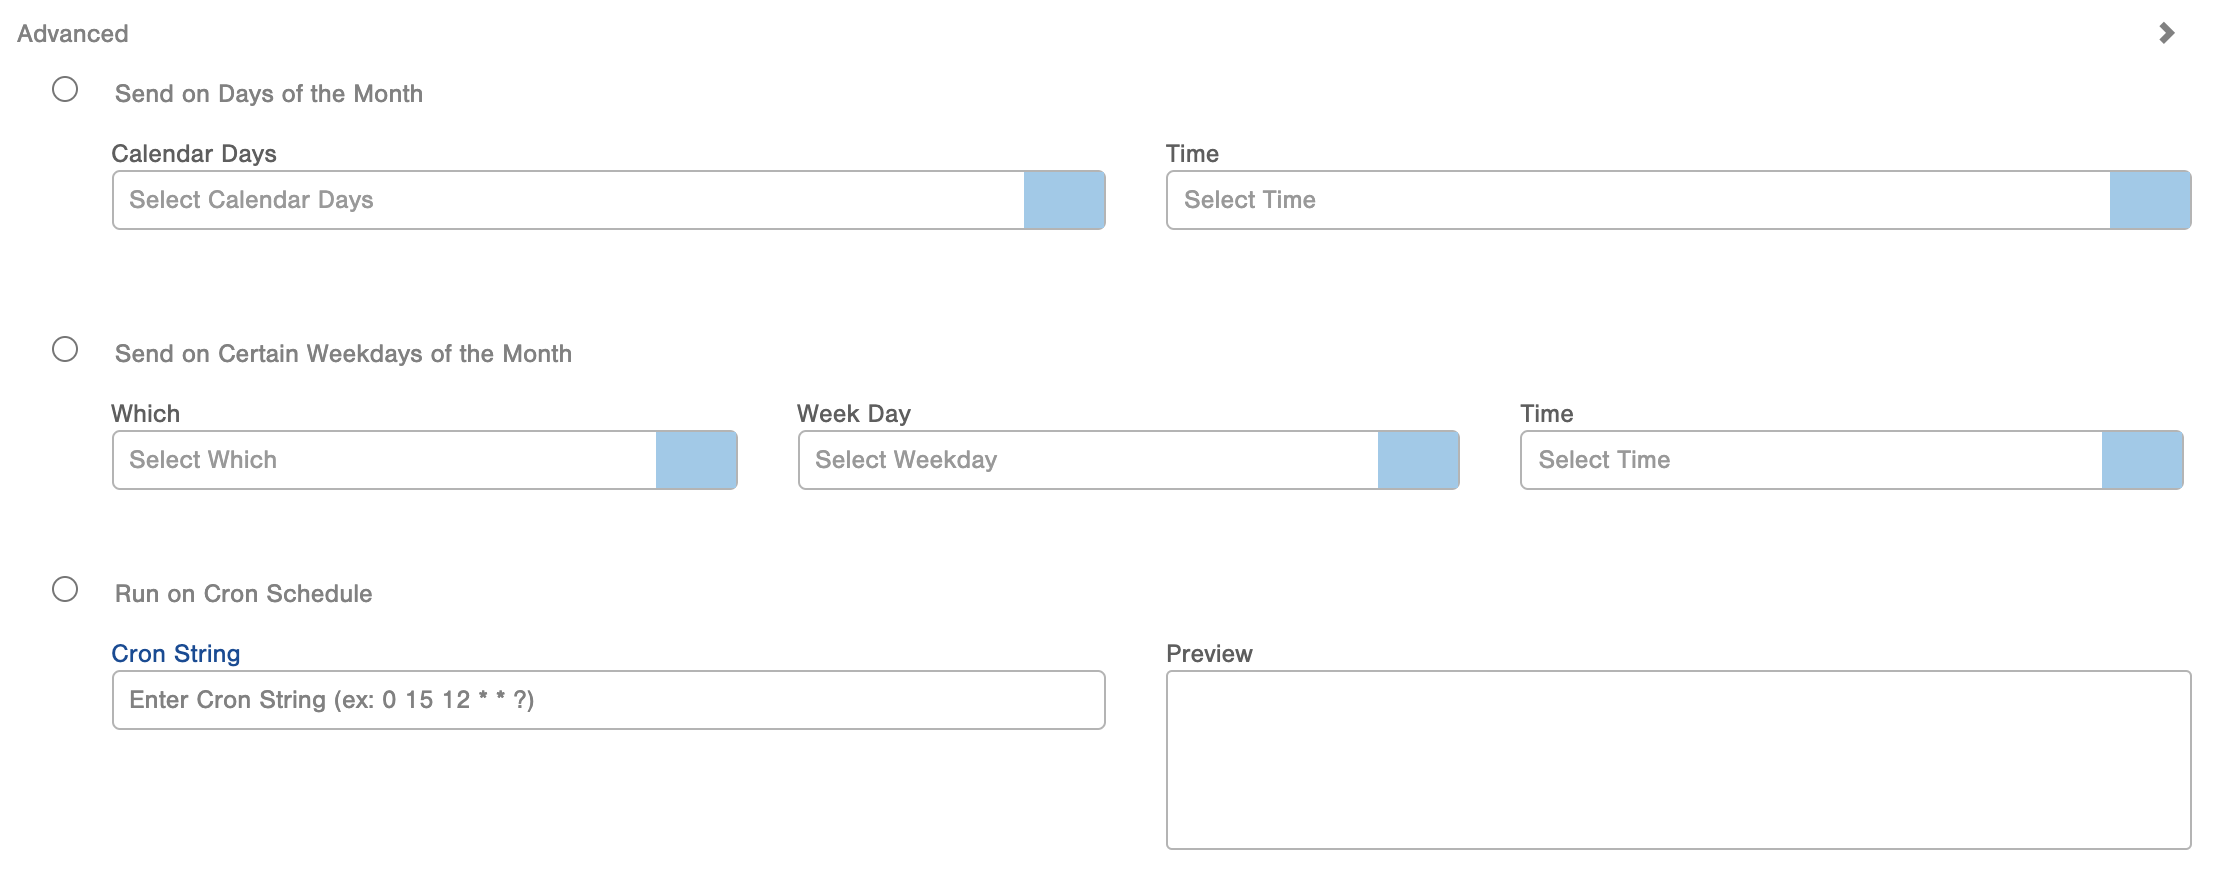
- Select the frequency in which the report is sent out
- Week Days: Sun-Fri
- Certain Days of the Month: 1st, Last, 15th etc.
- Certain Weekdays of the Month: Second Tuesday of Every Month
- Cron Schedule: Every 4 Hours, Every Other Day, Every 5 minutes on Tuesdays between 8 and 5 etc.
Pro Tip: You can send out test emails before saving the subscription. Once the email is sent out users will be able to directly download the report to excel or PDF.

Sharing the Report
Click on the sharing bubble icon to share the report with other users. Currently, you can only share with users one at a time.
Adding the Report to Your Dashboard (Favoriting)
To add the report to your dashboard, favorite the report by clicking on the star in front of it.


-1.png?height=120&name=InfoPlus-Primary-Logo%20(1)-1.png)